Hysteresis
Lesson #14—Non-ideal sensor propertiesSensor theory
Will your sensor always return the same value for the same stimulus? Does a measurement depend upon previous measurements?
Many real sensors exhibit the property of hysteresis, meaning that the measured value is dependent upon the history.
The light dependent resistor (LDR) circuit shown in Figs. 1 – 3 is a good case study in exploring the properties of a very cheap sensor.

Fig. 1: Schematic layout for LDR circuit.

Fig. 2: Breadboard layout for LDR circuit.
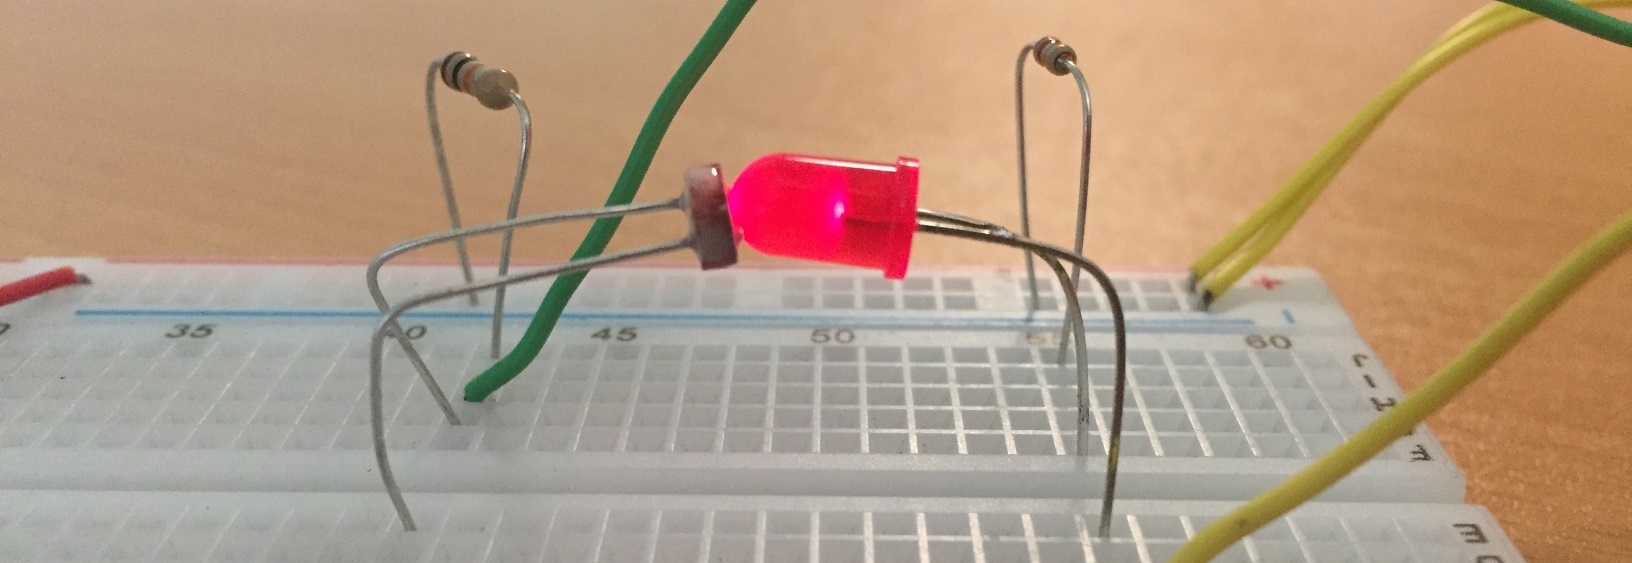
Fig. 3: Position the LED and LDR next to each other so that the LED light will shine upon the LDR.
We will use the LED as a light source to vary the light incident upon the LDR.
Once you have the position right, cover the breadboard with some paper or fabric to dampen the ambient light. An alternative would be to use cling wrap and alfoil (for electrical insulation and to block the light, respectively).
Electronics theory
The Arduino cannot output an analog value directly. However, it can approximate an analog signal by rapidly turning a voltage on and off (Fig. 4). Varying the duty cycle in this manner is called pulse width modulation.

Fig. 4: Pulse width modulation
Pulse width modulation in Arduinos requires a duty cycle that is defined to lie between 0 and 255. 0 means that the output is completely off and 255 means that it is completely on. The significance of 0..255 is that there it gives 256 possible states, and \(256 = 2^8\) so we see that PWM ratios are 8 bit quantities.
Not all Arduino pins are capable of PWM. The PWM-capable pins are labelled with
a tilde (~) on the circuit board.
Code
void setup() {
  // put your setup code here, to run once:

  // Set up pin 3 as an output.
  pinMode(3, OUTPUT);

  // Set the baud rate
  Serial.begin(9600);
}

void loop() {
  // put your main code here, to run repeatedly:

  // Sweep through the range of possible PWM duty cycles from
  // minimal brightness (0) to maximum brightness (255).
  int i;
  for (i = 0; i <= 255; i++) {
    analogWrite(3, i);

    Serial.print("Brightness: ");
    Serial.print(i / 2.55, 6); // 2nd parameter: 6 decimal points
    Serial.print("%");
    Serial.println();
  }
}
Exercise
An SD card is not the only way to load data from an Arduino system into Excel. You can also copy and paste data directly from the serial monitor.
Extend the above sample code to achieve the following:
- Sweep through a range of LED brightnesses from minimal brightness to maximum brightness.
- Set the brightness on the LED.
- Read the analog value from the LDR sensor, and convert it to a voltage.
- Print out the brightness and measured voltage as a space-separated list (see below).
Use the following data format for easy import into Excel:
0.00% 2.84
1.96% 2.95
3.92% 3.03
5.88% 3.12
...
Data analysis
- Copy the list of values from the Arduino Serial Monitor.
- Open Microsoft Excel.
- Select the cell A1 (or where you would like to paste your data).
- On the Home tab, click the arrow underneath Paste, and choose “Use Text Import Wizard”.
- Click through the Text Import Wizard to bring the data into Excel.
- Produce a scatterplot of voltage vs brightness.
You should end up with a result that looks like Fig. 5, below.
Fig. 5: Hysteresis effect using LDR. Arrows indicate the direction in which the brightness is being varied.

Topics for workshop discussion
- Hysteresis indicates that the stimulus is changing too quickly to be measured by the sensor. Slow down the speed at which it changes to prevent this issue.
- The voltage is not the best quantity to report. The sensor actually modulates its resistance. We can calculate the resistance using $$V_{A0} = 5\times\frac{R_3}{R_2 + R_3},$$ where \(R_2\) is the resistance of the LDR and \(R_3\) is the fixed load resistance (as per Fig. 1).
Solve for \(R_2\) to calculate the actual sensor response. - A criticism of this experiment is that we are assuming linearity in the diode brightness. A LED’s light output is (very close to) proportional to current. The current is \(I = (5-V_{diode})/R_1\), and \(V_{diode}\) is approximately independent of \(I\). A better solution would be to measure the current flowing through the diode and use that as the independent variable in the analysis. Measure the current by measuring the voltage across the load resistor and using Ohm’s law.
Extension Exercise
Discover the functional form of LDR resistance vs brightness. What shape trendline best fits the data? Can you find a transformation that makes it linear?
Answer: The approximate functional form of the LDR response is that resistance is inversely proportional to the light intensity. Therefore a plot of 1/Resistance vs brightness is approximately linear (Fig. 6).

Fig. 6: LDR sensor response. These data were captured with a 50 ms delay between each value to minimise hysteresis.